
Сбор статистики с помощью pfstat
19.10.2010 - 08:16
Далее идем править конфиг:
Создаем директорию в /usr/local/www:
Добавим в /etc/rc.conf, для возможности запуска демоном:
Запускаем:
Проверяем поднялся ли:
зы: демон pfstatd висит на 9999 порту.
В данный момент в /usr/local/www/pfstat просто набор сгенерированных картинок, давайте преобразим его в html.
pfstat — утилита, которая собирает статистику на сетевых интерфейсах и предоставляющая её в графическом виде, похожа на mrtg.
Устанавливать будем из портов:
[root@router /]#cd /usr/ports/sysutils/pfstat
[root@router /usr/ports/sysutils/pfstat]# make install clean
[root@router /usr/ports/sysutils/pfstat]# make install clean
Далее идем править конфиг:
[root@router /]# ee /etc/pfstat.conf
collect 1 = interface "tun0" pass bytes in ipv4 diff
collect 2 = interface "tun0" pass bytes out ipv4 diff
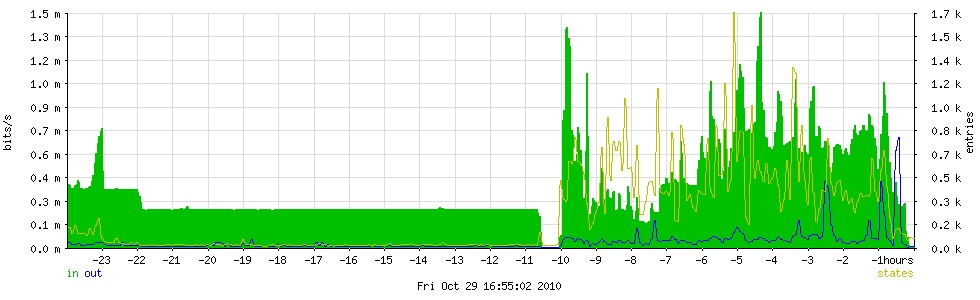
collect 3 = global states entries
image "/usr/local/www/pfstat/pfstat-day-small.jpg" {
from 24 hours to now
width 300 height 200
left
graph 1 bps "in" "bits/s" color 0 192 0 filled,
graph 2 bps "out" "bits/s" color 0 0 255
right
graph 3 "states" "entries" color 192 192 0
}
image "/usr/local/www/pfstat/pfstat-day-large.jpg" {
from 24 hours to now
width 980 height 300
left
graph 1 bps "in" "bits/s" color 0 192 0 filled,
graph 2 bps "out" "bits/s" color 0 0 255
right
graph 3 "states" "entries" color 192 192 0
}
image "/usr/local/www/pfstat/pfstat-week-small.jpg" {
from 7 days to now
width 300 height 200
left
graph 1 bps "in" "bits/s" color 0 192 0 filled,
graph 2 bps "out" "bits/s" color 0 0 255
right
graph 3 "states" "entries" color 192 192 0
}
image "/usr/local/www/pfstat/pfstat-week-large.jpg" {
from 7 days to now
width 980 height 300
left
graph 1 bps "in" "bits/s" color 0 192 0 filled,
graph 2 bps "out" "bits/s" color 0 0 255
right
graph 3 "states" "entries" color 192 192 0
}
image "/usr/local/www/pfstat/pfstat-month-small.jpg" {
from 4 weeks to now
width 300 height 200
left
graph 1 bps "in" "bits/s" color 0 192 0 filled,
graph 2 bps "out" "bits/s" color 0 0 255
right
graph 3 "states" "entries" color 192 192 0
}
image "/usr/local/www/pfstat/pfstat-month-large.jpg" {
from 4 weeks to now
width 980 height 300
left
graph 1 bps "in" "bits/s" color 0 192 0 filled,
graph 2 bps "out" "bits/s" color 0 0 255
right
graph 3 "states" "entries" color 192 192 0
}
image "/usr/local/www/pfstat/pfstat-year-small.jpg" {
from 12 months to now
width 300 height 200
left
graph 1 bps "in" "bits/s" color 0 192 0 filled,
graph 2 bps "out" "bits/s" color 0 0 255
right
graph 3 "states" "entries" color 192 192 0
}
image "/usr/local/www/pfstat/pfstat-year-large.jpg" {
from 12 months to now
width 980 height 300
left
graph 1 bps "in" "bits/s" color 0 192 0 filled,
graph 2 bps "out" "bits/s" color 0 0 255
right
graph 3 "states" "entries" color 192 192 0
}
collect 4 = interface "sis0" pass packets in ipv4 diff
collect 5 = interface "sis0" pass packets out ipv4 diff
collect 6 = interface "sis0" block packets in ipv4 diff
collect 7 = interface "sis0" block packets out ipv4 diff
image "/usr/local/www/pfstat/pfstat-packets-day-small.jpg" {
from 24 hours to now
width 300 height 200
left
graph 4 "pass in" "packets/s" color 0 192 0 filled,
graph 5 "pass out" "packets/s" color 0 0 255
right
graph 6 "block in" "packets/s" color 255 0 0,
graph 7 "block out" "packets/s" color 192 192 0
}
image "/usr/local/www/pfstat/pfstat-packets-day-large.jpg" {
from 24 hours to now
width 980 height 300
left
graph 4 "pass in" "packets/s" color 0 192 0 filled,
graph 5 "pass out" "packets/s" color 0 0 255
right
graph 6 "block in" "packets/s" color 255 0 0,
graph 7 "block out" "packets/s" color 192 192 0
}
image "/usr/local/www/pfstat/pfstat-packets-week-small.jpg" {
from 7 days to now
width 300 height 200
left
graph 4 "pass in" "packets/s" color 0 192 0 filled,
graph 5 "pass out" "packets/s" color 0 0 255
right
graph 6 "block in" "packets/s" color 255 0 0,
graph 7 "block out" "packets/s" color 192 192 0
}
image "/usr/local/www/pfstat/pfstat-packets-week-large.jpg" {
from 7 days to now
width 980 height 300
left
graph 4 "pass in" "packets/s" color 0 192 0 filled,
graph 5 "pass out" "packets/s" color 0 0 255
right
graph 6 "block in" "packets/s" color 255 0 0,
graph 7 "block out" "packets/s" color 192 192 0
}
image "/usr/local/www/pfstat/pfstat-packets-month-small.jpg" {
from 4 weeks to now
width 300 height 200
left
graph 4 "pass in" "packets/s" color 0 192 0 filled,
graph 5 "pass out" "packets/s" color 0 0 255
right
graph 6 "block in" "packets/s" color 255 0 0,
graph 7 "block out" "packets/s" color 192 192 0
}
image "/usr/local/www/pfstat/pfstat-packets-month-large.jpg" {
from 4 weeks to now
width 980 height 300
left
graph 4 "pass in" "packets/s" color 0 192 0 filled,
graph 5 "pass out" "packets/s" color 0 0 255
right
graph 6 "block in" "packets/s" color 255 0 0,
graph 7 "block out" "packets/s" color 192 192 0
}
image "/usr/local/www/pfstat/pfstat-packets-year-small.jpg" {
from 12 months to now
width 300 height 200
left
graph 4 "pass in" "packets/s" color 0 192 0 filled,
graph 5 "pass out" "packets/s" color 0 0 255
right
graph 6 "block in" "packets/s" color 255 0 0,
graph 7 "block out" "packets/s" color 192 192 0
}
image "/usr/local/www/pfstat/pfstat-packets-year-large.jpg" {
from 12 months to now
width 980 height 300
left
graph 4 "pass in" "packets/s" color 0 192 0 filled,
graph 5 "pass out" "packets/s" color 0 0 255
right
graph 6 "block in" "packets/s" color 255 0 0,
graph 7 "block out" "packets/s" color 192 192 0
}
collect 8 = global states inserts diff
collect 9 = global states removals diff
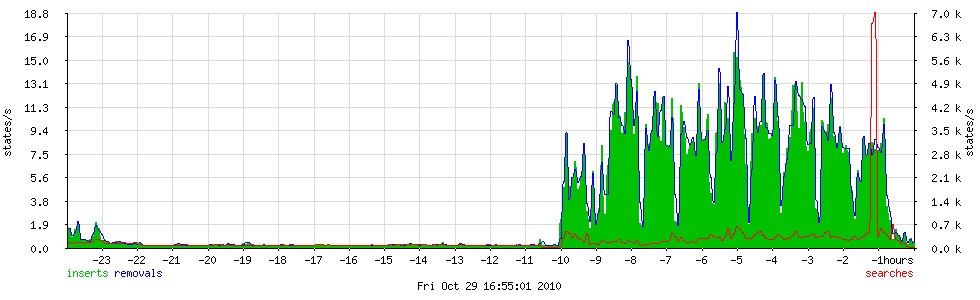
collect 10 = global states searches diff
image "/usr/local/www/pfstat/pfstat-states-day-small.jpg" {
from 24 hours to now
width 300 height 200
left
graph 8 "inserts" "states/s" color 0 192 0 filled,
graph 9 "removals" "states/s" color 0 0 255
right
graph 10 "searches" "states/s" color 255 0 0
}
image "/usr/local/www/pfstat/pfstat-states-day-large.jpg" {
from 24 hours to now
width 980 height 300
left
graph 8 "inserts" "states/s" color 0 192 0 filled,
graph 9 "removals" "states/s" color 0 0 255
right
graph 10 "searches" "states/s" color 255 0 0
}
image "/usr/local/www/pfstat/pfstat-states-week-small.jpg" {
from 7 days to now
width 300 height 200
left
graph 8 "inserts" "states/s" color 0 192 0 filled,
graph 9 "removals" "states/s" color 0 0 255
right
graph 10 "searches" "states/s" color 255 0 0
}
image "/usr/local/www/pfstat/pfstat-states-week-large.jpg" {
from 7 days to now
width 980 height 300
left
graph 8 "inserts" "states/s" color 0 192 0 filled,
graph 9 "removals" "states/s" color 0 0 255
right
graph 10 "searches" "states/s" color 255 0 0
}
image "/usr/local/www/pfstat/pfstat-states-month-small.jpg" {
from 4 weeks to now
width 300 height 200
left
graph 8 "inserts" "states/s" color 0 192 0 filled,
graph 9 "removals" "states/s" color 0 0 255
right
graph 10 "searches" "states/s" color 255 0 0
}
image "/usr/local/www/pfstat/pfstat-states-month-large.jpg" {
from 4 weeks to now
width 980 height 300
left
graph 8 "inserts" "states/s" color 0 192 0 filled,
graph 9 "removals" "states/s" color 0 0 255
right
graph 10 "searches" "states/s" color 255 0 0
}
image "/usr/local/www/pfstat/pfstat-states-year-small.jpg" {
from 12 months to now
width 300 height 200
left
graph 8 "inserts" "states/s" color 0 192 0 filled,
graph 9 "removals" "states/s" color 0 0 255
right
graph 10 "searches" "states/s" color 255 0 0
}
image "/usr/local/www/pfstat/pfstat-states-year-large.jpg" {
from 12 months to now
width 980 height 300
left
graph 8 "inserts" "states/s" color 0 192 0 filled,
graph 9 "removals" "states/s" color 0 0 255
right
graph 10 "searches" "states/s" color 255 0 0
}
collect 11 = queue "q_max" pass bytes diff
collect 12 = queue "q_hig" pass bytes diff
collect 13 = queue "q_def" pass bytes diff
collect 14 = queue "q_low" pass bytes diff
image "/usr/local/www/pfstat/pfstat-queues-day-small.jpg" {
from 24 hours to now
width 300 height 200
left
graph 11 bps "max" "bits/s" color 255 0 0,
graph 12 bps "hig" "bits/s" color 192 192 0,
graph 13 bps "def" "bits/s" color 0 192 0,
graph 14 bps "low" "bits/s" color 0 0 255
}
image "/usr/local/www/pfstat/pfstat-queues-day-large.jpg" {
from 24 hours to now
width 980 height 300
left
graph 11 bps "max" "bits/s" color 255 0 0,
graph 12 bps "hig" "bits/s" color 192 192 0,
graph 13 bps "def" "bits/s" color 0 192 0,
graph 14 bps "low" "bits/s" color 0 0 255
}
image "/usr/local/www/pfstat/pfstat-queues-week-small.jpg" {
from 7 days to now
width 300 height 200
left
graph 11 bps "max" "bits/s" color 255 0 0,
graph 12 bps "hig" "bits/s" color 192 192 0,
graph 13 bps "def" "bits/s" color 0 192 0,
graph 14 bps "low" "bits/s" color 0 0 255
}
image "/usr/local/www/pfstat/pfstat-queues-week-large.jpg" {
from 7 days to now
width 980 height 300
left
graph 11 bps "max" "bits/s" color 255 0 0,
graph 12 bps "hig" "bits/s" color 192 192 0,
graph 13 bps "def" "bits/s" color 0 192 0,
graph 14 bps "low" "bits/s" color 0 0 255
}
image "/usr/local/www/pfstat/pfstat-queues-month-small.jpg" {
from 4 weeks to now
width 300 height 200
left
graph 11 bps "max" "bits/s" color 255 0 0,
graph 12 bps "hig" "bits/s" color 192 192 0,
graph 13 bps "def" "bits/s" color 0 192 0,
graph 14 bps "low" "bits/s" color 0 0 255
}
image "/usr/local/www/pfstat/pfstat-queues-month-large.jpg" {
from 4 weeks to now
width 980 height 300
left
graph 11 bps "max" "bits/s" color 255 0 0,
graph 12 bps "hig" "bits/s" color 192 192 0,
graph 13 bps "def" "bits/s" color 0 192 0,
graph 14 bps "low" "bits/s" color 0 0 255
}
image "/usr/local/www/pfstat/pfstat-queues-year-small.jpg" {
from 12 months to now
width 300 height 200
left
graph 11 bps "max" "bits/s" color 255 0 0,
graph 12 bps "hig" "bits/s" color 192 192 0,
graph 13 bps "def" "bits/s" color 0 192 0,
graph 14 bps "low" "bits/s" color 0 0 255
}
image "/usr/local/www/pfstat/pfstat-queues-year-large.jpg" {
from 12 months to now
width 980 height 300
left
graph 11 bps "max" "bits/s" color 255 0 0,
graph 12 bps "hig" "bits/s" color 192 192 0,
graph 13 bps "def" "bits/s" color 0 192 0,
graph 14 bps "low" "bits/s" color 0 0 255
}
collect 15 = global counters match diff
collect 16 = global counters bad-offset diff
collect 17 = global counters fragment diff
collect 18 = global counters short diff
collect 19 = global counters normalize diff
collect 20 = global counters memory diff
collect 21 = global counters bad-timestamp diff
collect 22 = global counters congestion diff
collect 23 = global counters ip-option diff
collect 24 = global counters proto-cksum diff
collect 25 = global counters state-mismatch diff
collect 26 = global counters state-insert diff
collect 27 = global counters state-limit diff
collect 28 = global counters src-limit diff
collect 29 = global counters synproxy diff
image "/usr/local/www/pfstat/pfstat-errors-day-small.jpg" {
from 24 hours to now
width 300 height 200
left
graph 17 "frag" "/s" color 192 0 192,
graph 22 "cong" "/s" color 0 192 192,
graph 23 "iopt" "/s" color 0 0 255,
graph 24 "csum" "/s" color 192 192 0,
graph 25 "mism" "/s" color 255 0 0
right
graph 15 "match" "/s" color 0 192 0
}
image "/usr/local/www/pfstat/pfstat-errors-day-large.jpg" {
from 24 hours to now
width 980 height 300
left
graph 17 "frag" "/s" color 192 0 192,
graph 22 "cong" "/s" color 0 192 192,
graph 23 "iopt" "/s" color 0 0 255,
graph 24 "csum" "/s" color 192 192 0,
graph 25 "mism" "/s" color 255 0 0
right
graph 15 "match" "/s" color 0 192 0
}
image "/usr/local/www/pfstat/pfstat-errors-week-small.jpg" {
from 7 days to now
width 300 height 200
left
graph 17 "frag" "/s" color 192 0 192,
graph 22 "cong" "/s" color 0 192 192,
graph 23 "iopt" "/s" color 0 0 255,
graph 24 "csum" "/s" color 192 192 0,
graph 25 "mism" "/s" color 255 0 0
right
graph 15 "match" "/s" color 0 192 0
}
image "/usr/local/www/pfstat/pfstat-errors-week-large.jpg" {
from 7 days to now
width 980 height 300
left
graph 17 "frag" "/s" color 192 0 192,
graph 22 "cong" "/s" color 0 192 192,
graph 23 "iopt" "/s" color 0 0 255,
graph 24 "csum" "/s" color 192 192 0,
graph 25 "mism" "/s" color 255 0 0
right
graph 15 "match" "/s" color 0 192 0
}
image "/usr/local/www/pfstat/pfstat-errors-month-small.jpg" {
from 4 weeks to now
width 300 height 200
left
graph 17 "frag" "/s" color 192 0 192,
graph 22 "cong" "/s" color 0 192 192,
graph 23 "iopt" "/s" color 0 0 255,
graph 24 "csum" "/s" color 192 192 0,
graph 25 "mism" "/s" color 255 0 0
right
graph 15 "match" "/s" color 0 192 0
}
image "/usr/local/www/pfstat/pfstat-errors-month-large.jpg" {
from 4 weeks to now
width 980 height 300
left
graph 17 "frag" "/s" color 192 0 192,
graph 22 "cong" "/s" color 0 192 192,
graph 23 "iopt" "/s" color 0 0 255,
graph 24 "csum" "/s" color 192 192 0,
graph 25 "mism" "/s" color 255 0 0
right
graph 15 "match" "/s" color 0 192 0
}
image "/usr/local/www/pfstat/pfstat-errors-year-small.jpg" {
from 12 months to now
width 300 height 200
left
graph 17 "frag" "/s" color 192 0 192,
graph 22 "cong" "/s" color 0 192 192,
graph 23 "iopt" "/s" color 0 0 255,
graph 24 "csum" "/s" color 192 192 0,
graph 25 "mism" "/s" color 255 0 0
right
graph 15 "match" "/s" color 0 192 0
}
image "/usr/local/www/pfstat/pfstat-errors-year-large.jpg" {
from 12 months to now
width 980 height 300
left
graph 17 "frag" "/s" color 192 0 192,
graph 22 "cong" "/s" color 0 192 192,
graph 23 "iopt" "/s" color 0 0 255,
graph 24 "csum" "/s" color 192 192 0,
graph 25 "mism" "/s" color 255 0 0
right
graph 15 "match" "/s" color 0 192 0
}
collect 2 = interface "tun0" pass bytes out ipv4 diff
collect 3 = global states entries
image "/usr/local/www/pfstat/pfstat-day-small.jpg" {
from 24 hours to now
width 300 height 200
left
graph 1 bps "in" "bits/s" color 0 192 0 filled,
graph 2 bps "out" "bits/s" color 0 0 255
right
graph 3 "states" "entries" color 192 192 0
}
image "/usr/local/www/pfstat/pfstat-day-large.jpg" {
from 24 hours to now
width 980 height 300
left
graph 1 bps "in" "bits/s" color 0 192 0 filled,
graph 2 bps "out" "bits/s" color 0 0 255
right
graph 3 "states" "entries" color 192 192 0
}
image "/usr/local/www/pfstat/pfstat-week-small.jpg" {
from 7 days to now
width 300 height 200
left
graph 1 bps "in" "bits/s" color 0 192 0 filled,
graph 2 bps "out" "bits/s" color 0 0 255
right
graph 3 "states" "entries" color 192 192 0
}
image "/usr/local/www/pfstat/pfstat-week-large.jpg" {
from 7 days to now
width 980 height 300
left
graph 1 bps "in" "bits/s" color 0 192 0 filled,
graph 2 bps "out" "bits/s" color 0 0 255
right
graph 3 "states" "entries" color 192 192 0
}
image "/usr/local/www/pfstat/pfstat-month-small.jpg" {
from 4 weeks to now
width 300 height 200
left
graph 1 bps "in" "bits/s" color 0 192 0 filled,
graph 2 bps "out" "bits/s" color 0 0 255
right
graph 3 "states" "entries" color 192 192 0
}
image "/usr/local/www/pfstat/pfstat-month-large.jpg" {
from 4 weeks to now
width 980 height 300
left
graph 1 bps "in" "bits/s" color 0 192 0 filled,
graph 2 bps "out" "bits/s" color 0 0 255
right
graph 3 "states" "entries" color 192 192 0
}
image "/usr/local/www/pfstat/pfstat-year-small.jpg" {
from 12 months to now
width 300 height 200
left
graph 1 bps "in" "bits/s" color 0 192 0 filled,
graph 2 bps "out" "bits/s" color 0 0 255
right
graph 3 "states" "entries" color 192 192 0
}
image "/usr/local/www/pfstat/pfstat-year-large.jpg" {
from 12 months to now
width 980 height 300
left
graph 1 bps "in" "bits/s" color 0 192 0 filled,
graph 2 bps "out" "bits/s" color 0 0 255
right
graph 3 "states" "entries" color 192 192 0
}
collect 4 = interface "sis0" pass packets in ipv4 diff
collect 5 = interface "sis0" pass packets out ipv4 diff
collect 6 = interface "sis0" block packets in ipv4 diff
collect 7 = interface "sis0" block packets out ipv4 diff
image "/usr/local/www/pfstat/pfstat-packets-day-small.jpg" {
from 24 hours to now
width 300 height 200
left
graph 4 "pass in" "packets/s" color 0 192 0 filled,
graph 5 "pass out" "packets/s" color 0 0 255
right
graph 6 "block in" "packets/s" color 255 0 0,
graph 7 "block out" "packets/s" color 192 192 0
}
image "/usr/local/www/pfstat/pfstat-packets-day-large.jpg" {
from 24 hours to now
width 980 height 300
left
graph 4 "pass in" "packets/s" color 0 192 0 filled,
graph 5 "pass out" "packets/s" color 0 0 255
right
graph 6 "block in" "packets/s" color 255 0 0,
graph 7 "block out" "packets/s" color 192 192 0
}
image "/usr/local/www/pfstat/pfstat-packets-week-small.jpg" {
from 7 days to now
width 300 height 200
left
graph 4 "pass in" "packets/s" color 0 192 0 filled,
graph 5 "pass out" "packets/s" color 0 0 255
right
graph 6 "block in" "packets/s" color 255 0 0,
graph 7 "block out" "packets/s" color 192 192 0
}
image "/usr/local/www/pfstat/pfstat-packets-week-large.jpg" {
from 7 days to now
width 980 height 300
left
graph 4 "pass in" "packets/s" color 0 192 0 filled,
graph 5 "pass out" "packets/s" color 0 0 255
right
graph 6 "block in" "packets/s" color 255 0 0,
graph 7 "block out" "packets/s" color 192 192 0
}
image "/usr/local/www/pfstat/pfstat-packets-month-small.jpg" {
from 4 weeks to now
width 300 height 200
left
graph 4 "pass in" "packets/s" color 0 192 0 filled,
graph 5 "pass out" "packets/s" color 0 0 255
right
graph 6 "block in" "packets/s" color 255 0 0,
graph 7 "block out" "packets/s" color 192 192 0
}
image "/usr/local/www/pfstat/pfstat-packets-month-large.jpg" {
from 4 weeks to now
width 980 height 300
left
graph 4 "pass in" "packets/s" color 0 192 0 filled,
graph 5 "pass out" "packets/s" color 0 0 255
right
graph 6 "block in" "packets/s" color 255 0 0,
graph 7 "block out" "packets/s" color 192 192 0
}
image "/usr/local/www/pfstat/pfstat-packets-year-small.jpg" {
from 12 months to now
width 300 height 200
left
graph 4 "pass in" "packets/s" color 0 192 0 filled,
graph 5 "pass out" "packets/s" color 0 0 255
right
graph 6 "block in" "packets/s" color 255 0 0,
graph 7 "block out" "packets/s" color 192 192 0
}
image "/usr/local/www/pfstat/pfstat-packets-year-large.jpg" {
from 12 months to now
width 980 height 300
left
graph 4 "pass in" "packets/s" color 0 192 0 filled,
graph 5 "pass out" "packets/s" color 0 0 255
right
graph 6 "block in" "packets/s" color 255 0 0,
graph 7 "block out" "packets/s" color 192 192 0
}
collect 8 = global states inserts diff
collect 9 = global states removals diff
collect 10 = global states searches diff
image "/usr/local/www/pfstat/pfstat-states-day-small.jpg" {
from 24 hours to now
width 300 height 200
left
graph 8 "inserts" "states/s" color 0 192 0 filled,
graph 9 "removals" "states/s" color 0 0 255
right
graph 10 "searches" "states/s" color 255 0 0
}
image "/usr/local/www/pfstat/pfstat-states-day-large.jpg" {
from 24 hours to now
width 980 height 300
left
graph 8 "inserts" "states/s" color 0 192 0 filled,
graph 9 "removals" "states/s" color 0 0 255
right
graph 10 "searches" "states/s" color 255 0 0
}
image "/usr/local/www/pfstat/pfstat-states-week-small.jpg" {
from 7 days to now
width 300 height 200
left
graph 8 "inserts" "states/s" color 0 192 0 filled,
graph 9 "removals" "states/s" color 0 0 255
right
graph 10 "searches" "states/s" color 255 0 0
}
image "/usr/local/www/pfstat/pfstat-states-week-large.jpg" {
from 7 days to now
width 980 height 300
left
graph 8 "inserts" "states/s" color 0 192 0 filled,
graph 9 "removals" "states/s" color 0 0 255
right
graph 10 "searches" "states/s" color 255 0 0
}
image "/usr/local/www/pfstat/pfstat-states-month-small.jpg" {
from 4 weeks to now
width 300 height 200
left
graph 8 "inserts" "states/s" color 0 192 0 filled,
graph 9 "removals" "states/s" color 0 0 255
right
graph 10 "searches" "states/s" color 255 0 0
}
image "/usr/local/www/pfstat/pfstat-states-month-large.jpg" {
from 4 weeks to now
width 980 height 300
left
graph 8 "inserts" "states/s" color 0 192 0 filled,
graph 9 "removals" "states/s" color 0 0 255
right
graph 10 "searches" "states/s" color 255 0 0
}
image "/usr/local/www/pfstat/pfstat-states-year-small.jpg" {
from 12 months to now
width 300 height 200
left
graph 8 "inserts" "states/s" color 0 192 0 filled,
graph 9 "removals" "states/s" color 0 0 255
right
graph 10 "searches" "states/s" color 255 0 0
}
image "/usr/local/www/pfstat/pfstat-states-year-large.jpg" {
from 12 months to now
width 980 height 300
left
graph 8 "inserts" "states/s" color 0 192 0 filled,
graph 9 "removals" "states/s" color 0 0 255
right
graph 10 "searches" "states/s" color 255 0 0
}
collect 11 = queue "q_max" pass bytes diff
collect 12 = queue "q_hig" pass bytes diff
collect 13 = queue "q_def" pass bytes diff
collect 14 = queue "q_low" pass bytes diff
image "/usr/local/www/pfstat/pfstat-queues-day-small.jpg" {
from 24 hours to now
width 300 height 200
left
graph 11 bps "max" "bits/s" color 255 0 0,
graph 12 bps "hig" "bits/s" color 192 192 0,
graph 13 bps "def" "bits/s" color 0 192 0,
graph 14 bps "low" "bits/s" color 0 0 255
}
image "/usr/local/www/pfstat/pfstat-queues-day-large.jpg" {
from 24 hours to now
width 980 height 300
left
graph 11 bps "max" "bits/s" color 255 0 0,
graph 12 bps "hig" "bits/s" color 192 192 0,
graph 13 bps "def" "bits/s" color 0 192 0,
graph 14 bps "low" "bits/s" color 0 0 255
}
image "/usr/local/www/pfstat/pfstat-queues-week-small.jpg" {
from 7 days to now
width 300 height 200
left
graph 11 bps "max" "bits/s" color 255 0 0,
graph 12 bps "hig" "bits/s" color 192 192 0,
graph 13 bps "def" "bits/s" color 0 192 0,
graph 14 bps "low" "bits/s" color 0 0 255
}
image "/usr/local/www/pfstat/pfstat-queues-week-large.jpg" {
from 7 days to now
width 980 height 300
left
graph 11 bps "max" "bits/s" color 255 0 0,
graph 12 bps "hig" "bits/s" color 192 192 0,
graph 13 bps "def" "bits/s" color 0 192 0,
graph 14 bps "low" "bits/s" color 0 0 255
}
image "/usr/local/www/pfstat/pfstat-queues-month-small.jpg" {
from 4 weeks to now
width 300 height 200
left
graph 11 bps "max" "bits/s" color 255 0 0,
graph 12 bps "hig" "bits/s" color 192 192 0,
graph 13 bps "def" "bits/s" color 0 192 0,
graph 14 bps "low" "bits/s" color 0 0 255
}
image "/usr/local/www/pfstat/pfstat-queues-month-large.jpg" {
from 4 weeks to now
width 980 height 300
left
graph 11 bps "max" "bits/s" color 255 0 0,
graph 12 bps "hig" "bits/s" color 192 192 0,
graph 13 bps "def" "bits/s" color 0 192 0,
graph 14 bps "low" "bits/s" color 0 0 255
}
image "/usr/local/www/pfstat/pfstat-queues-year-small.jpg" {
from 12 months to now
width 300 height 200
left
graph 11 bps "max" "bits/s" color 255 0 0,
graph 12 bps "hig" "bits/s" color 192 192 0,
graph 13 bps "def" "bits/s" color 0 192 0,
graph 14 bps "low" "bits/s" color 0 0 255
}
image "/usr/local/www/pfstat/pfstat-queues-year-large.jpg" {
from 12 months to now
width 980 height 300
left
graph 11 bps "max" "bits/s" color 255 0 0,
graph 12 bps "hig" "bits/s" color 192 192 0,
graph 13 bps "def" "bits/s" color 0 192 0,
graph 14 bps "low" "bits/s" color 0 0 255
}
collect 15 = global counters match diff
collect 16 = global counters bad-offset diff
collect 17 = global counters fragment diff
collect 18 = global counters short diff
collect 19 = global counters normalize diff
collect 20 = global counters memory diff
collect 21 = global counters bad-timestamp diff
collect 22 = global counters congestion diff
collect 23 = global counters ip-option diff
collect 24 = global counters proto-cksum diff
collect 25 = global counters state-mismatch diff
collect 26 = global counters state-insert diff
collect 27 = global counters state-limit diff
collect 28 = global counters src-limit diff
collect 29 = global counters synproxy diff
image "/usr/local/www/pfstat/pfstat-errors-day-small.jpg" {
from 24 hours to now
width 300 height 200
left
graph 17 "frag" "/s" color 192 0 192,
graph 22 "cong" "/s" color 0 192 192,
graph 23 "iopt" "/s" color 0 0 255,
graph 24 "csum" "/s" color 192 192 0,
graph 25 "mism" "/s" color 255 0 0
right
graph 15 "match" "/s" color 0 192 0
}
image "/usr/local/www/pfstat/pfstat-errors-day-large.jpg" {
from 24 hours to now
width 980 height 300
left
graph 17 "frag" "/s" color 192 0 192,
graph 22 "cong" "/s" color 0 192 192,
graph 23 "iopt" "/s" color 0 0 255,
graph 24 "csum" "/s" color 192 192 0,
graph 25 "mism" "/s" color 255 0 0
right
graph 15 "match" "/s" color 0 192 0
}
image "/usr/local/www/pfstat/pfstat-errors-week-small.jpg" {
from 7 days to now
width 300 height 200
left
graph 17 "frag" "/s" color 192 0 192,
graph 22 "cong" "/s" color 0 192 192,
graph 23 "iopt" "/s" color 0 0 255,
graph 24 "csum" "/s" color 192 192 0,
graph 25 "mism" "/s" color 255 0 0
right
graph 15 "match" "/s" color 0 192 0
}
image "/usr/local/www/pfstat/pfstat-errors-week-large.jpg" {
from 7 days to now
width 980 height 300
left
graph 17 "frag" "/s" color 192 0 192,
graph 22 "cong" "/s" color 0 192 192,
graph 23 "iopt" "/s" color 0 0 255,
graph 24 "csum" "/s" color 192 192 0,
graph 25 "mism" "/s" color 255 0 0
right
graph 15 "match" "/s" color 0 192 0
}
image "/usr/local/www/pfstat/pfstat-errors-month-small.jpg" {
from 4 weeks to now
width 300 height 200
left
graph 17 "frag" "/s" color 192 0 192,
graph 22 "cong" "/s" color 0 192 192,
graph 23 "iopt" "/s" color 0 0 255,
graph 24 "csum" "/s" color 192 192 0,
graph 25 "mism" "/s" color 255 0 0
right
graph 15 "match" "/s" color 0 192 0
}
image "/usr/local/www/pfstat/pfstat-errors-month-large.jpg" {
from 4 weeks to now
width 980 height 300
left
graph 17 "frag" "/s" color 192 0 192,
graph 22 "cong" "/s" color 0 192 192,
graph 23 "iopt" "/s" color 0 0 255,
graph 24 "csum" "/s" color 192 192 0,
graph 25 "mism" "/s" color 255 0 0
right
graph 15 "match" "/s" color 0 192 0
}
image "/usr/local/www/pfstat/pfstat-errors-year-small.jpg" {
from 12 months to now
width 300 height 200
left
graph 17 "frag" "/s" color 192 0 192,
graph 22 "cong" "/s" color 0 192 192,
graph 23 "iopt" "/s" color 0 0 255,
graph 24 "csum" "/s" color 192 192 0,
graph 25 "mism" "/s" color 255 0 0
right
graph 15 "match" "/s" color 0 192 0
}
image "/usr/local/www/pfstat/pfstat-errors-year-large.jpg" {
from 12 months to now
width 980 height 300
left
graph 17 "frag" "/s" color 192 0 192,
graph 22 "cong" "/s" color 0 192 192,
graph 23 "iopt" "/s" color 0 0 255,
graph 24 "csum" "/s" color 192 192 0,
graph 25 "mism" "/s" color 255 0 0
right
graph 15 "match" "/s" color 0 192 0
}
Создаем директорию в /usr/local/www:
[root@router /]# mkdir /usr/local/www/pfstat
Добавим в /etc/rc.conf, для возможности запуска демоном:
pfstatd_enable="YES"
Запускаем:
[root@router /]# /usr/local/etc/rc.d/pfstatd start
Starting pfstatd.
Starting pfstatd.
Проверяем поднялся ли:
[root@router /usr/local/etc/rc.d]# ./pfstatd status
pfstatd is running as pid 89295.
pfstatd is running as pid 89295.
Добавим в крон:
[root@router /]# cat /etc/crontab
*/5 * * * * root /usr/local/bin/pfstat -p -q -r 192.168.1.1:9999 -c /etc/pfstat.conf
зы: демон pfstatd висит на 9999 порту.
В данный момент в /usr/local/www/pfstat просто набор сгенерированных картинок, давайте преобразим его в html.
[root@router /]#cat > /usr/local/www/pfstat/index.html
<!DOCTYPE HTML PUBLIC "-//W3C//DTD HTML 4.01 Transitional//EN">
<html>
<head>
<meta http-equiv="Content-Type" content="text/html; charset=US-ASCII">
<title>Packet Filter Statistics</title>
</head>
<body text="#000000" bgcolor="#FFFFFF" link="#1919C0" vlink="#101030" alink="#FE0000">
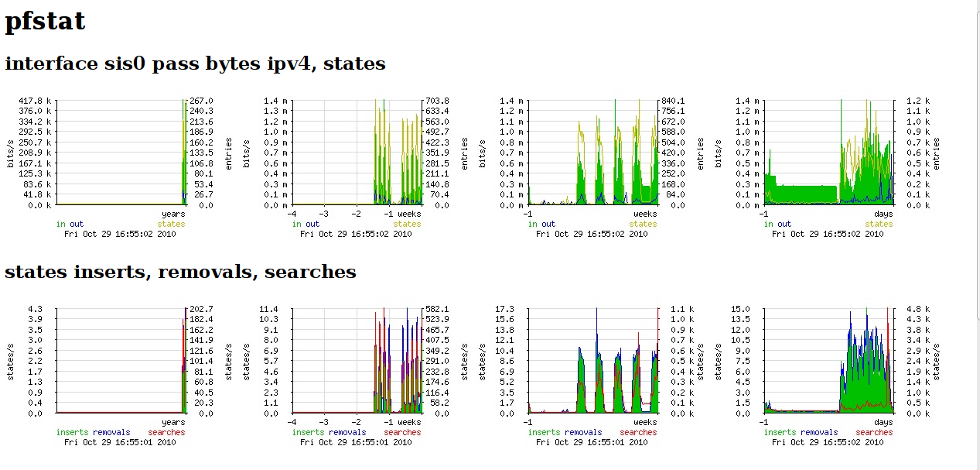
<h1>pfstat</h1>
<h2>interface sis0 pass bytes ipv4, states</h2>
<a href="pfstat-year-large.jpg"><img src="pfstat-year-small.jpg" border="0"></a>
<a href="pfstat-month-large.jpg"><img src="pfstat-month-small.jpg" border="0"></a>
<a href="pfstat-week-large.jpg"><img src="pfstat-week-small.jpg" border="0"></a>
<a href="pfstat-day-large.jpg"><img src="pfstat-day-small.jpg" border="0"></a>
<p>
<h2>states inserts, removals, searches</h2>
<a href="pfstat-states-year-large.jpg"><img src="pfstat-states-year-small.jpg" border="0"></a>
<a href="pfstat-states-month-large.jpg"><img src="pfstat-states-month-small.jpg" border="0"></a>
<a href="pfstat-states-week-large.jpg"><img src="pfstat-states-week-small.jpg" border="0"></a>
<a href="pfstat-states-day-large.jpg"><img src="pfstat-states-day-small.jpg" border="0"></a>
<p>
<h2>interface sis0 pass/block packets ipv4</h2>
<a href="pfstat-packets-year-large.jpg"><img src="pfstat-packets-year-small.jpg" border="0"></a>
<a href="pfstat-packets-month-large.jpg"><img src="pfstat-packets-month-small.jpg" border="0"></a>
<a href="pfstat-packets-week-large.jpg"><img src="pfstat-packets-week-small.jpg" border="0"></a>
<a href="pfstat-packets-day-large.jpg"><img src="pfstat-packets-day-small.jpg" border="0"></a>
<p>
<h2>interface sis0 queues</h2>
<a href="pfstat-queues-year-large.jpg"><img src="pfstat-queues-year-small.jpg" border="0"></a>
<a href="pfstat-queues-month-large.jpg"><img src="pfstat-queues-month-small.jpg" border="0"></a>
<a href="pfstat-queues-week-large.jpg"><img src="pfstat-queues-week-small.jpg" border="0"></a>
<a href="pfstat-queues-day-large.jpg"><img src="pfstat-queues-day-small.jpg" border="0"></a>
<p>
<h2>global counters</h2>
<a href="pfstat-errors-year-large.jpg"><img src="pfstat-errors-year-small.jpg" border="0"></a>
<a href="pfstat-errors-month-large.jpg"><img src="pfstat-errors-month-small.jpg" border="0"></a>
<a href="pfstat-errors-week-large.jpg"><img src="pfstat-errors-week-small.jpg" border="0"></a>
<a href="pfstat-errors-day-large.jpg"><img src="pfstat-errors-day-small.jpg" border="0"></a>
<p>
</body>
</html>
<html>
<head>
<meta http-equiv="Content-Type" content="text/html; charset=US-ASCII">
<title>Packet Filter Statistics</title>
</head>
<body text="#000000" bgcolor="#FFFFFF" link="#1919C0" vlink="#101030" alink="#FE0000">
<h1>pfstat</h1>
<h2>interface sis0 pass bytes ipv4, states</h2>
<a href="pfstat-year-large.jpg"><img src="pfstat-year-small.jpg" border="0"></a>
<a href="pfstat-month-large.jpg"><img src="pfstat-month-small.jpg" border="0"></a>
<a href="pfstat-week-large.jpg"><img src="pfstat-week-small.jpg" border="0"></a>
<a href="pfstat-day-large.jpg"><img src="pfstat-day-small.jpg" border="0"></a>
<p>
<h2>states inserts, removals, searches</h2>
<a href="pfstat-states-year-large.jpg"><img src="pfstat-states-year-small.jpg" border="0"></a>
<a href="pfstat-states-month-large.jpg"><img src="pfstat-states-month-small.jpg" border="0"></a>
<a href="pfstat-states-week-large.jpg"><img src="pfstat-states-week-small.jpg" border="0"></a>
<a href="pfstat-states-day-large.jpg"><img src="pfstat-states-day-small.jpg" border="0"></a>
<p>
<h2>interface sis0 pass/block packets ipv4</h2>
<a href="pfstat-packets-year-large.jpg"><img src="pfstat-packets-year-small.jpg" border="0"></a>
<a href="pfstat-packets-month-large.jpg"><img src="pfstat-packets-month-small.jpg" border="0"></a>
<a href="pfstat-packets-week-large.jpg"><img src="pfstat-packets-week-small.jpg" border="0"></a>
<a href="pfstat-packets-day-large.jpg"><img src="pfstat-packets-day-small.jpg" border="0"></a>
<p>
<h2>interface sis0 queues</h2>
<a href="pfstat-queues-year-large.jpg"><img src="pfstat-queues-year-small.jpg" border="0"></a>
<a href="pfstat-queues-month-large.jpg"><img src="pfstat-queues-month-small.jpg" border="0"></a>
<a href="pfstat-queues-week-large.jpg"><img src="pfstat-queues-week-small.jpg" border="0"></a>
<a href="pfstat-queues-day-large.jpg"><img src="pfstat-queues-day-small.jpg" border="0"></a>
<p>
<h2>global counters</h2>
<a href="pfstat-errors-year-large.jpg"><img src="pfstat-errors-year-small.jpg" border="0"></a>
<a href="pfstat-errors-month-large.jpg"><img src="pfstat-errors-month-small.jpg" border="0"></a>
<a href="pfstat-errors-week-large.jpg"><img src="pfstat-errors-week-small.jpg" border="0"></a>
<a href="pfstat-errors-day-large.jpg"><img src="pfstat-errors-day-small.jpg" border="0"></a>
<p>
</body>
</html>
Теперь можно смотреть в красиво в браузере:
http://localsite/
- Войдите на сайт для отправки комментариев
 Версия для печати
у меня так
*/5 * * * * /usr/local/bin/pfstat -p -d /var/log/pfstat -c /etc/pfstat.conf > /dev/null 2>&1
30 1 * * * /usr/local/bin/pfstat -t 60 -d /var/log/pfstat -c /etc/pfstat.conf > /dev/null 2>&1
/usr/local/bin/pfstat -t 60 удаляет статистику старше 60 дней